We are happy to announce that Vaadin TestBench 4.0 has been released today.
While we maintained full backward compatibility, this is a major overhaul of the underlying technology, bringing some cool new ways of doing UI testing for your Vaadin applications.
Typesafe UI testing
In order to make it super easy to find and interact with UI components in your Vaadin applications, we created ElementQuery. ElementQuery allows you to find components in a logical way, using a fluent Java API. The API is accessible through the $ method in the TestBenchTestCase class. I think the best way to explain it is through a few examples:
|
Finds the first Button on the screen |
|
|
Finds the Button with the specified ID |
|
|
Finds the Button that reads “cancel” |
|
|
Finds the first Button that is inside a GridLayout, which, in turn, is inside of a Panel |
You can substitute ButtonElement with any Vaadin component, e.g. ComboBoxElement or MenuBarElement, etc.
But wait, there’s more: Most of the *Element classes already have a type safe component specific API, which makes it super easy to interact with them. Learn more in the online API documentation.
Point and click with Debug window
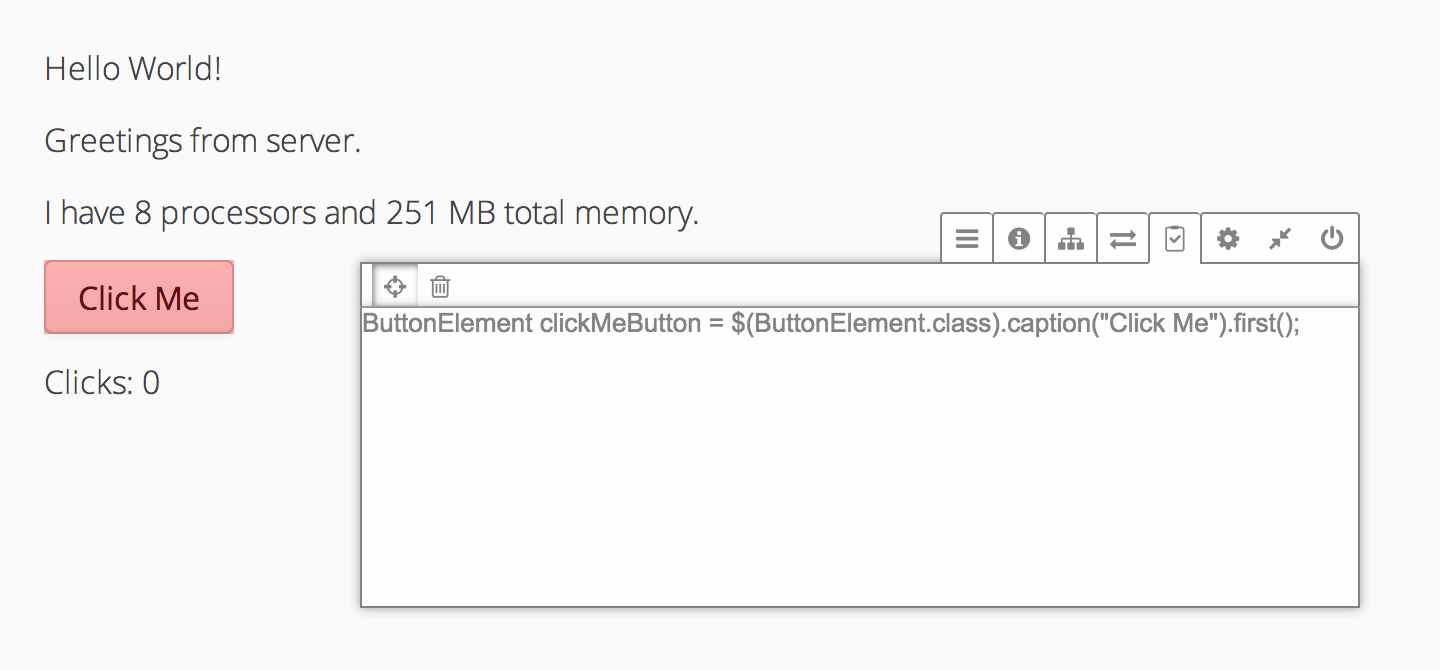
While the programming of test cases is intuitive and effective, it might be hard to select the parts of the UI to test in your code. That is why we introduced the possibility to point-and-click to select Vaadin components when using the debug window. Here is how you do it:
- Make sure your application is not running in production mode.
- Open the application in your browser and add special ?debug parameter in the end of the url, like http://localhost:8080/myappcontext?debug
- Keeping the debug window open, navigate to the view you want to test.
- Look for the (
 ) icon to open the TestBench tab in the debug window.
 - Switch to selection mode by pressing the (
 ) icon, and choose the component which you need to reference in your test case. You see the necessary code generated in the debug window.
 - Copy the code to your test case class and assert correct behavior of your app.

Start testing your application today
- If you just want to check how TestBench 4 works in a minimal setup, check out the TestBench “Hello World”.
- If you want to check a more complete example setup with screenshot testing, check out the Calculator test application.
- To really help you get started with testbench in your own existing project and to help you get on the right track, we wrote an extensive TestBench 4 tutorial.
Now, you have no need to postpone your UI testing. :)