
Servlet session size has been a myth for ages. Many Java developers tend to religiously avoid storing anything in session because somebody at Google said that shouldn’t be done. With Vaadin Flow, that is the root of all goodness. The pure Java development model, the productivity, and the simplicity Vaadin Flow provides are based on storing the core part of the UI state in the JVM memory.
New Vaadin developers often have concerns regarding the size of the session and the number of concurrent users a single node can handle, even though other memory requirements are usually more significant. While the answer to these questions is not straightforward and depends on various factors, it is very likely that the requirements will be met. This article will provide examples, tools, and best practices for measuring and calculating these requirements.
As an example application for this tutorial, I used an app generated by a template via start.vaadin.com and its Master-Detail view. It is not the most complex UI, but not the simplest one either. I configured PostgreSQL for the Spring Boot application to be as close to a typical business app as possible and executed all the tests with my laptop.
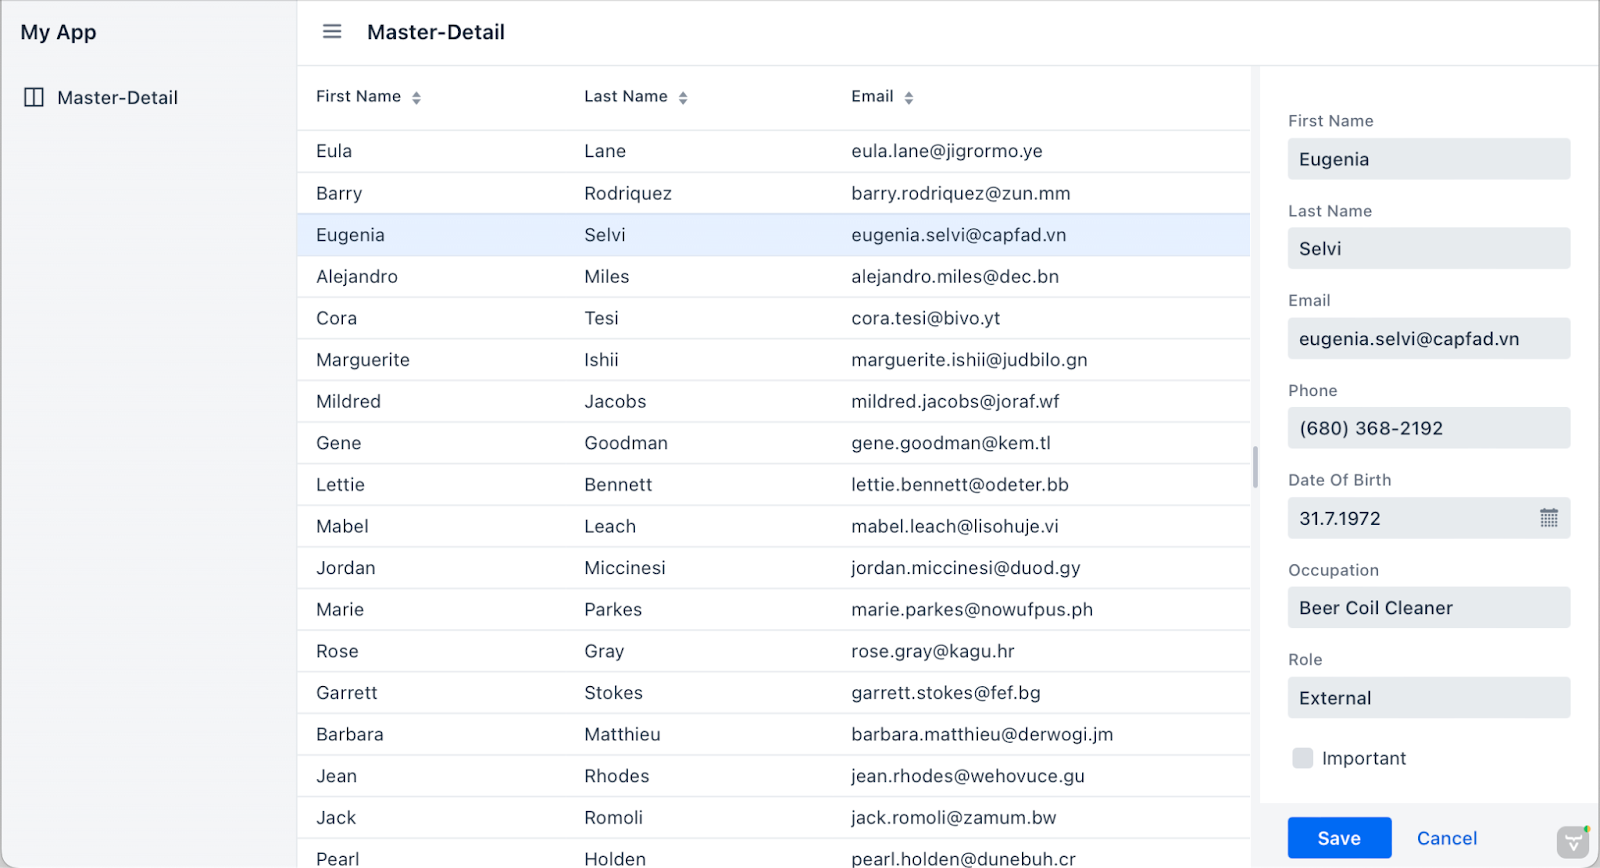
A screenshot of the test app generated using a start.vaadin.com project template.
Note that even though we have only one view with this test app, the results ought to be pretty similar, even if we had 100 of these kinds of views in our application, as Vaadin only loads the active UI into the memory.
Quick estimates using heap analysis of individual UIs
Intuitively thinking, you should be able to calculate the memory consumption from a heap dump with tools like VisualVM, JProfiler, or a tool built directly into your IDE. In reality, things can be more complicated than that because of caching, proxies, and all sorts of pools we have in our modern Java web apps.
The most lightweight and trivial method to estimate memory consumption is to:
- Run the development server. It is best to make and run a production build without tools like JRebel or Spring DevTools. For these tests, I executed
mvn clean install -Pproductions; java -jar target/*.jar - Open the web application with a browser so that a session is initiated and a typical UI state is on the screen.
- Take a heap dump of the JVM.
- Calculate the retained size of the
VaadinSessionor individual UI instances. I tend to investigate the individual UIs so that I can compare the memory pressure of individual views with a single browser session. The overhead of theVaadinSessionis typically irrelevant. - Run the garbage collector and see how much heap you have left.
- Calculate how many new sessions will fit in.
In theory, this should already tell quite a bit about the memory constraints a single user causes for the system. In practice, this is only a theoretical upper limit. The way your backend consumes memory usage probably also changes along with the number of users due to larger pools, caching, and buffers needed during the requests. Calculating the retained size properly can also be hard for the tooling due to the usage of weak references and possibly shared data.
Using this tool provides a reliable baseline number with minimal effort. These are good tools to master, for example, to investigate possibly memory-heavy parts or actual memory leaks in your application.
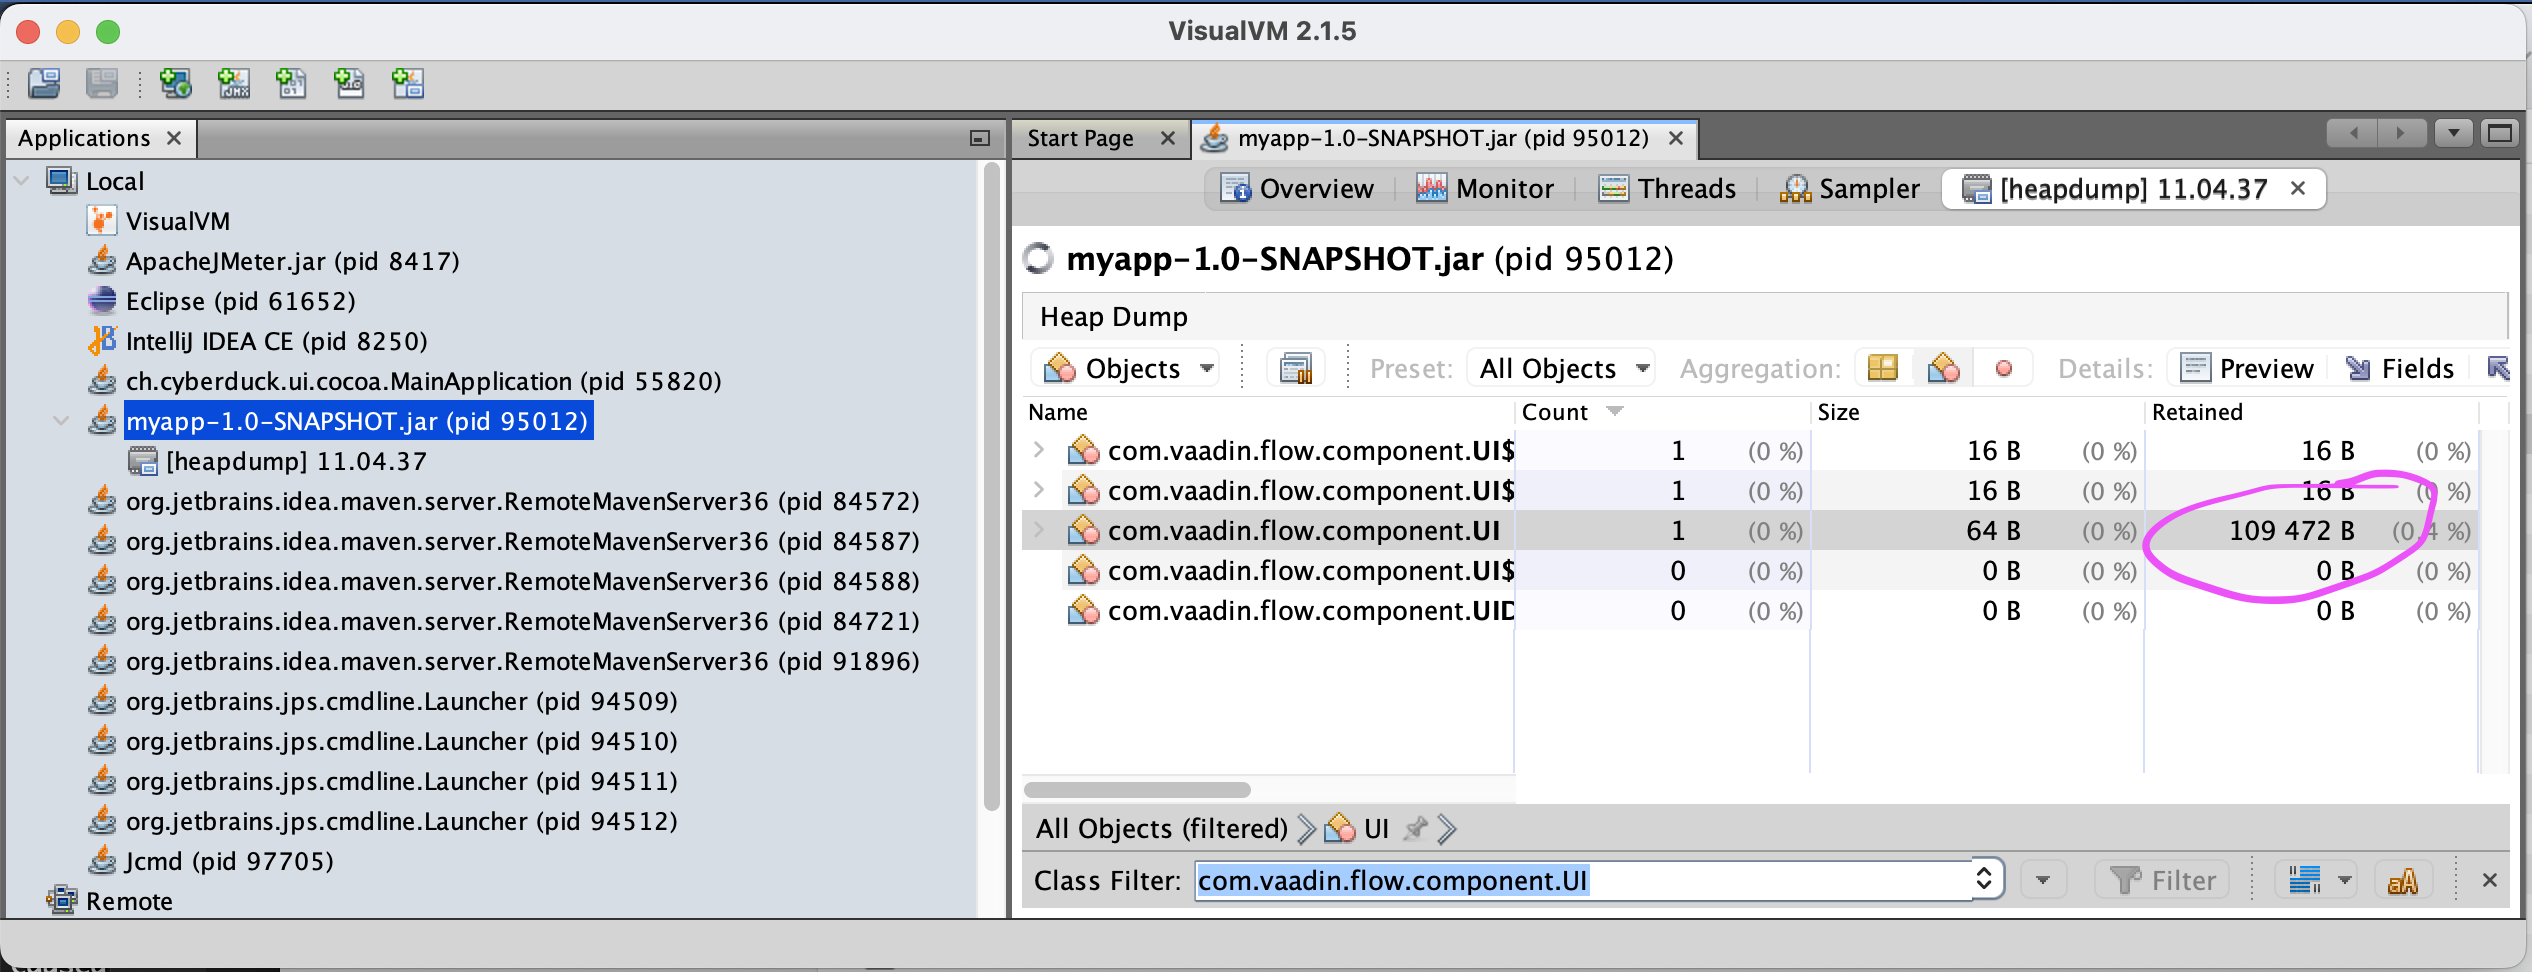
A screenshot of a VisualVM session inspecting the size of a typical Vaadin UI.
With my test app, the size of a single-user session was roughly 110 kilobytes (109 kb for the UI and 111 kb for the actual HTTP session). The heap usage of everything else (Tomcat, Spring, caches, buffers et al.) is ~ 26 megabytes, which doesn't grow that much per user.
Note that in addition to the rather static 26 MB heap usage, there is also so-called “meta space” (loaded classes, etc.) and overhead by the JVM, which is far more significant. In practice, a modern JVM web application stack eats roughly 200 MB of memory to serve the first users. Subsequent users are relatively inexpensive. Therefore, using small nodes to host JVM apps is generally not resource-efficient.
For example, if you have only 512 MB of memory per server node, after overheads of the JVM, OS, etc., you probably can’t reserve much more than 256 MB for the JVM heap. With this Vaadin application, that would mean more than 2k active users and ~250 kb of memory needed per user. With this kind of small node, the memory usage of “everything else'' consumes more than the actual user sessions. If you increase the node size to 2 GB, your node can already take in more than 16k sessions and ~ 120kb per user, more than twice as efficient as with 512 MB nodes.
Calculations based on heap size growth
Using this method, we don’t trust the profilers' retained size calculations but actually measure how much new sessions eat up the heap. The good thing about this approach is that it gives you more realistic numbers, e.g., caches used by backend systems are included. The bad part is that your side needs a bit more effort.
Let’s simplify the memory consumption of a web app in this kind of formula, where A is the fixed size needed for the app, B is the amount of memory needed per user, and x is the number of users:
A + x*B = H
Now to solve A and B, we need two measurements. The A can be considered rather static, but we can’t measure that with a server with no sessions, as some services are most likely started up lazily. But with one user, we are probably close enough, and this is still an estimation anyways.
I first opened a single window against a freshly started server and forced garbage collection using VisualVM, and read the used heap from the monitor tab (heap dump is not necessary here). Then opened 9 additional windows (in incognito mode) and again took the heap size after GC.
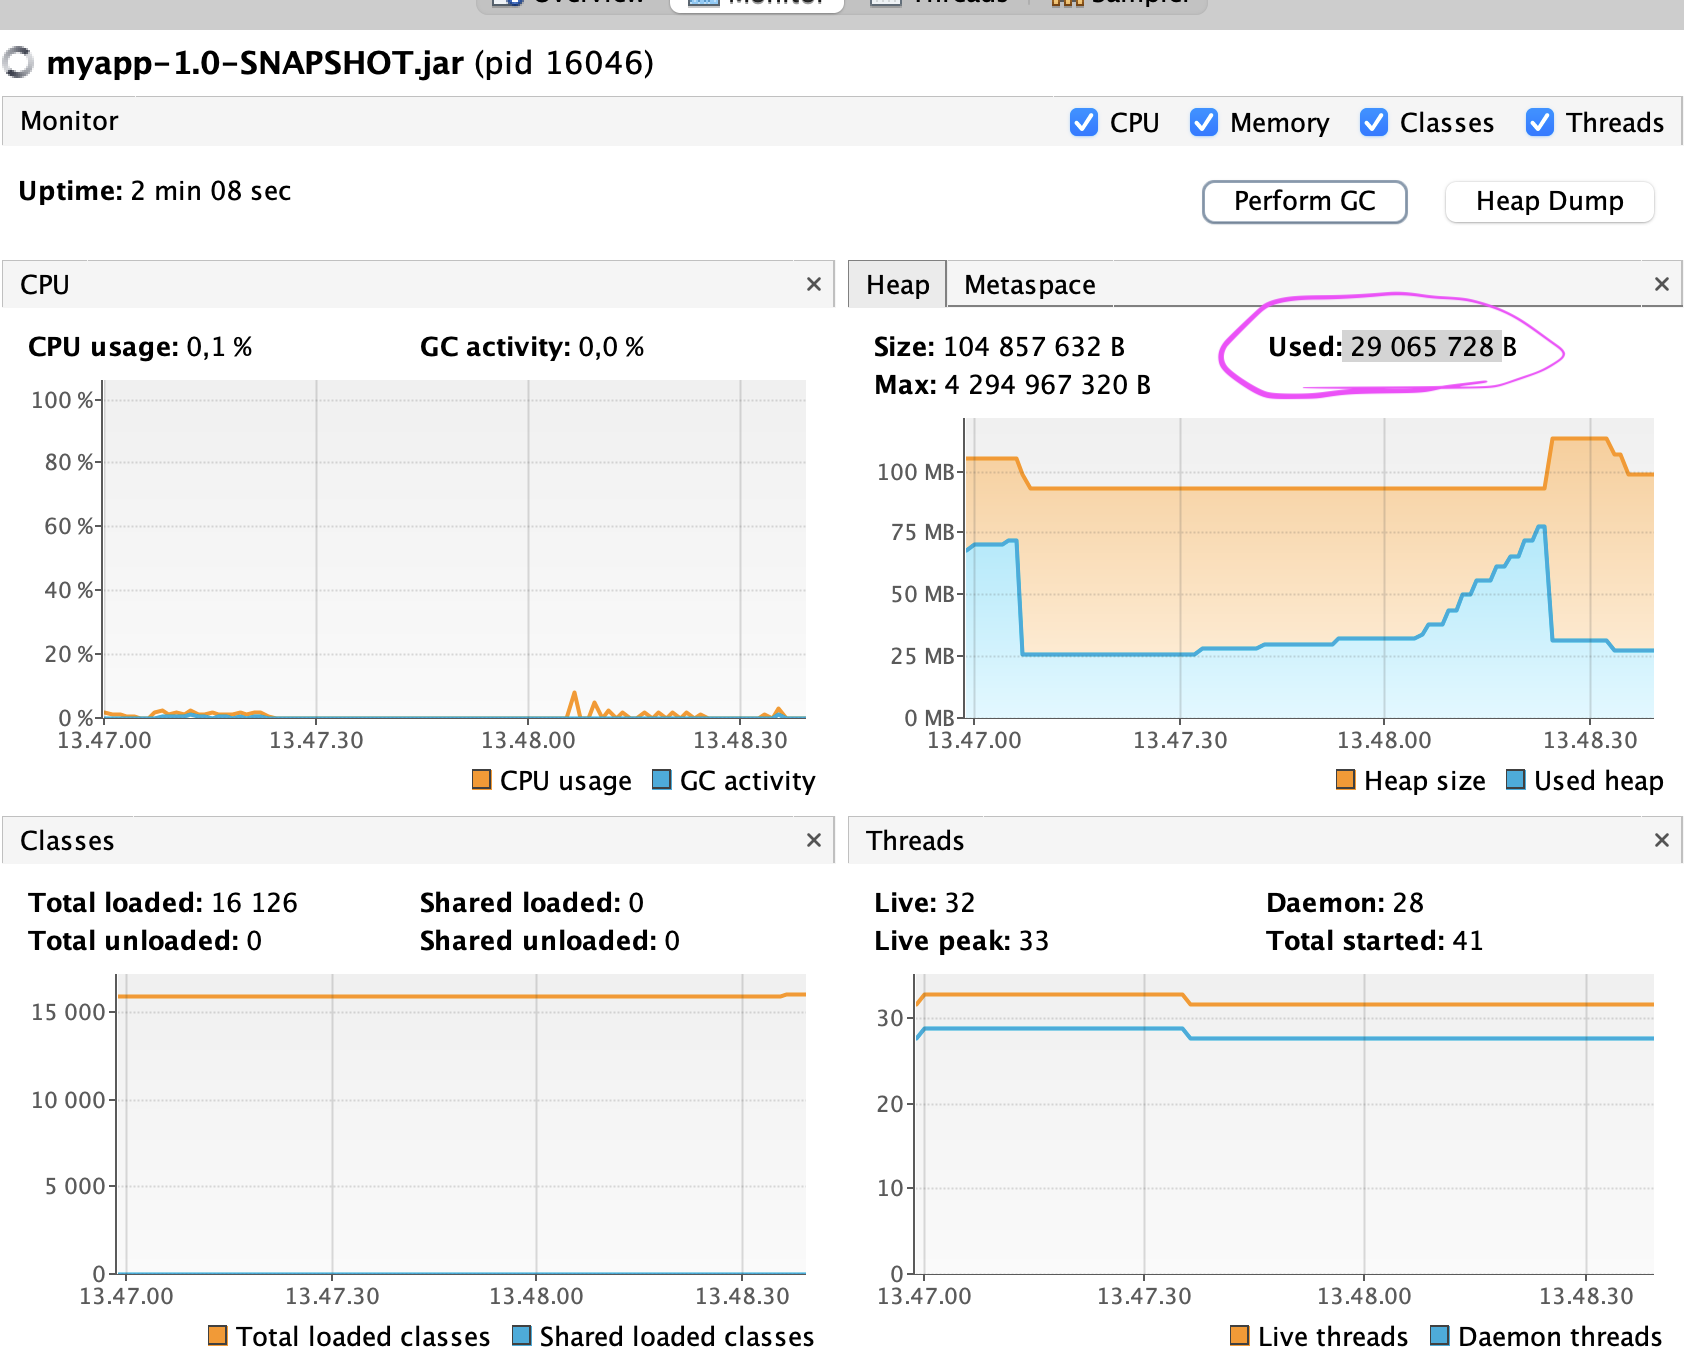
The monitor tab in VisualVM after 10 UIs open and GC executed. You’ll see aggressively growing heap usage when UIs are opened, but this is typical for Java web servers to maintain their buffers and free them lazily. When GC runs (or is forced as here), the actually used memory can be seen.
Now these are my numbers:
A + 1*B = 27951480
A + 10*B = 29068760
This system of two linear equations would resolve into B being roughly 124kB (memory needed for each session) and 28 MB for A (shared among all sessions). As expected, the estimated session size is a bit higher than just taking the retained size of the UI via heap analysis, but roughly the scale.
You will probably get more accurate estimates if you use larger amounts of sessions (for example, 100, 200) for the measurements, but that isn’t that easy to accomplish manually. An option is to utilize some automated tools to simulate users. For example, you can easily use Vaadin TestBench or some actual load-testing tool to automate the opening of the browser sessions. But if you are setting up an actual load-testing environment, you might want to go all in and measure the actual limits of your system.
Most realistic numbers using actual load testing
In the previous tests, we have still been far from the true limits of the server and only estimated what it could handle. But if you want to get truly trustworthy results, it is best to drive so much traffic to the server that you will actually get it on its knees. Start so many sessions that you’ll get your first out-of-memory error on your server log or until the server simply stops responding.
However, doing that with a SPA web framework like Vaadin Flow isn't trivial. Google Chrome memory usage can be counted in hundreds of megabytes these days, and their server-side counterpart is typically just a fraction of that. It is just not feasible to test using real browsers. You can't generate meaningful loads using simple tools like curl or ab (Apache Bench). In practice, you’ll need to drop in an actual load-testing tool like JMeter or Gatlin to put even a small server node to its knees.
In this example, I’m using Apache JMeter because it is free, and I have a bit more experience with it in the past, but I suggest you look into Gatlin, especially if you really need a lot of loads. These tools simulate users at the network level, not by rendering the web pages. Compared to controlling real browsers with tools like WebDriver, this saves enormous amounts of memory and CPU cycles from the tester's side. From the server node's point of view, everything will be pretty much the same as with actual users.
I recorded a JMeter test for my test app that navigates to the master-detail view and selects an entity for editing. To make the script work, I followed these instructions and added workarounds for some additional security measures Vaadin implements.
Based on my previous experiences, I believe that with defaults, I would discover the limits of JMeter and various operating system limits on my Mac rather than the limits of the Vaadin Flow application.
Thus I limited my server heap to 1GB. Next, I started hitting the server with chunks of 1000 sessions that started within 10 seconds. At the same time, I had both the result summary of JMeter and OS task manager open.
Both JMeter and the server were able to handle this still fine. You will see some peaks and both a docker process that is taking care of the PostgreSQL server. With more than 1000 concurrent simulations from JMeter, you might soon end up having problems without tuning things like available file descriptors in your OS and how much is allowed for single processes. As the default session timeout is 30 minutes, I have plenty of time to click the play button before the server starts to clean the old sessions.
With 1 gigabyte, the application can handle 9000 sessions easily. Then the CPU runs through the roof, and responses are simply not handled after 9300 sessions. Most probably, GC is trying to cope with the remaining tiny bit of memory. 1 gigabyte isn’t much, even for a hobby server, and in proper modern servers, the memory is counted in hundreds of gigabytes or terabytes.
One 16xlarge node from AWS could serve this app for almost 5 million concurrent server-side sessions with a single node. 16xlarge has 512 gigabytes of memory, and with the latest memory-optimized nodes, the memory is now counted in terabytes. I would be more afraid of database scalability than memory.
I’m not saying that you shouldn’t care about the resources you are using where it makes sense. With better resource utilization, you can save both natural resources and money. In the next blog post, I’ll present a couple of tips and tricks you can do to optimize your Vaadin Flow-based web UI.
New to Vaadin Flow? Learn to build and deploy a modern web app 100% in Java with Vaadin Quick Start ->